Fil:Population curve.svg

Størrelse for denne PNG-forhåndsvisningen av denne SVG-filen: 547 × 332 piksler Andre oppløsninger: 320 × 194 piksler | 640 × 388 piksler | 1 024 × 622 piksler | 1 280 × 777 piksler | 2 560 × 1 554 piksler.
Opprinnelig fil (SVG-fil, standardstørrelse 547 × 332 piksler, filstørrelse: 10 KB)
| Denne filen er fra Wikimedia Commons og kan brukes av andre prosjekter. Informasjonen fra filbeskrivelsessiden vises nedenfor. |
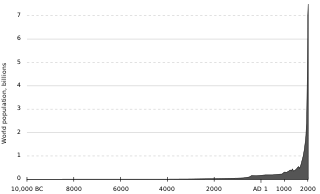
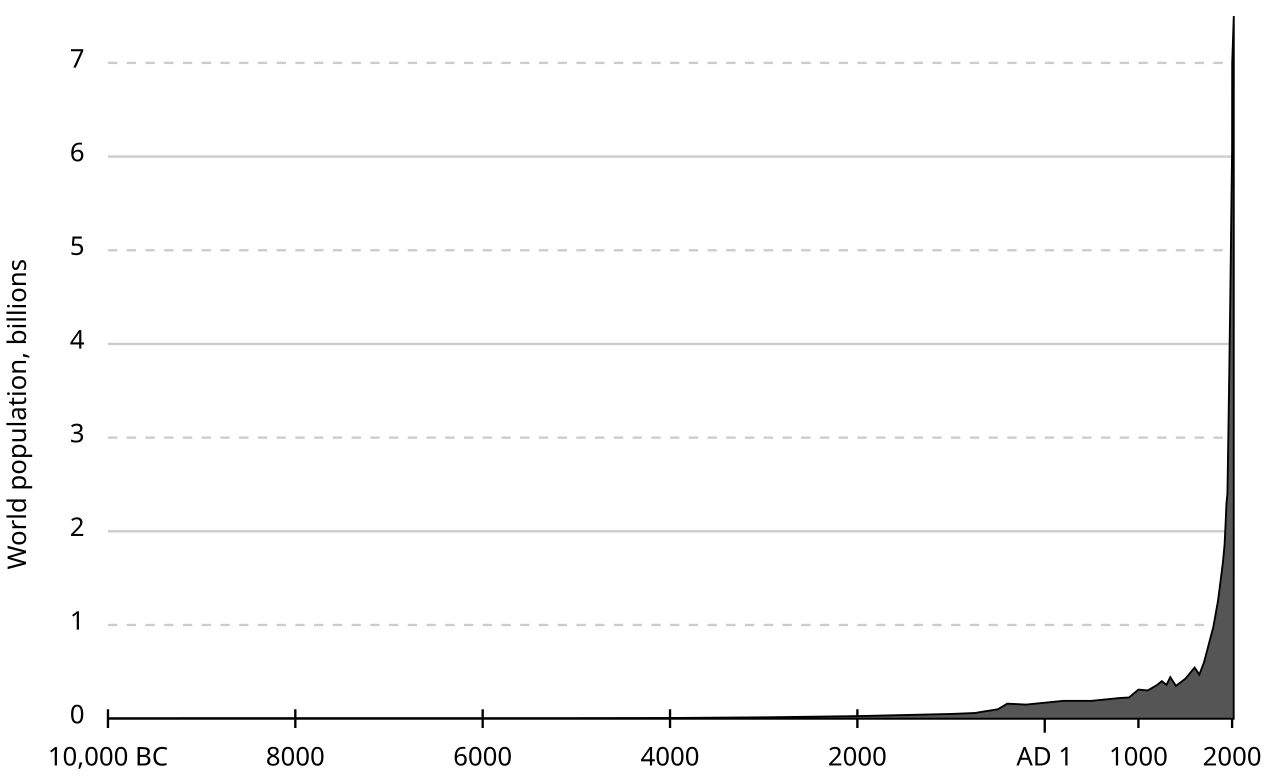
| Beskrivelse | World human population (est.) 10,000 BC–2000 AD. |
| Kilde | originally uploaded to en.wikipedia as Population curve.svg. The data is from the "lower" estimates at census.gov (archive.org mirror). |
| Opphavsperson | El T |
| Andre versjoner | File:Population curve-ar.svg |
| Dette verket har blitt frigitt til allmennheten av opphavspersonen El T at engelsk Wikipedia. Dette gjelder på verdensbasis. I enkelte land kan dette være juridisk umulig. I så fall: El T gir hvem som helst retten til å bruke dette verket for ethvert formål, uten noen vilkår, med mindre slike vilkår kreves ved lov. |
Data
year   world population (millions)
-10000 4
-8000  5
-7000  5
-6000  5
-5000  5
-4000  7
-3000  14
-2000  27
-1000  50
-750   60
-500   100
-400   160
-200   150
1      170
200    190
400    190
500    190
600    200
700    210
800    220
900    226
1000   310
1100   301
1200   360
1250   400
1300   360
1340   443
1400   350
1500   425
1600   545
1650   470
1700   600
1750   790
1800   980
1850   1260
1900   1650
1910   1750
1920   1860
1930   2070
1940   2300
1950   2400
1960   3020
1970   3700
1974   4000
1980   4430
1987   5000
1990   5260
2000   6070
2000   6500 (July 2)*
2000   6747.5 (October 2)*
2001   7000 (March 15)*
2001   7000.025 (April 21)*

*) Data points as actually plotted in 2012-05-24 revision
   (exact X axis values are 2000.5, 2000.75, 2001.2 and 2001.3)
   These are probably incorrect.
Sources
- Biraben, Jean-Noel, 1980, An Essay Concerning Mankind's Evolution, Population, Selected Papers, December, table 2.
- Durand, John D., 1974, "Historical Estimates of World Population: An Evaluation," University of Pennsylvania, Population Center, Analytical and Technical Reports, Number 10, table 2.
- Haub, Carl, 1995, "How Many People Have Ever Lived on Earth?" Population Today, February, p. 5.
- McEvedy, Colin and Richard Jones, 1978, "Atlas of World Population History," Facts on File, New York, pp. 342-351.
- Thomlinson, Ralph, 1975, "Demographic Problems, Controversy Over Population Control," Second Edition, Table 1.
- United Nations (UN), 1973, The Determinants and Consequences ofPopulation Trends, Population Studies, No. 50., p.10.
- United Nations, 1999, The World at Six Billion, Table 1, "World Population From" Year 0 to Stabilization, p. 5, http://www.un.org/esa/population/publications/sixbillion/sixbilpart1.pdf
- U.S. Census Bureau (USCB), 2008, "Total Midyear Population for the World: 1950-2050", Data updated 12-15-2008, https://www.census.gov\/ipc/www/idb/worldpop.html
Filhistorikk
Klikk på et tidspunkt for å vise filen slik den var på det tidspunktet.
| Dato/klokkeslett | Miniatyrbilde | Dimensjoner | Bruker | Kommentar | |
|---|---|---|---|---|---|
| nåværende | 16. aug. 2017 kl. 00:24 | | 547 × 332 (10 KB) | Gregor Hagedorn | Updating to 2017/7.5 billion |
| 21. jul. 2015 kl. 11:25 |  | 550 × 325 (10 KB) | JorisvS | Reverted to version as of 12:45, 24 May 2012: It breaks the text and numbers in the graph | |
| 20. mai 2015 kl. 20:44 |  | 2 500 × 1 478 (15 KB) | GregKaye | moving to bronze age time scale | |
| 24. mai 2012 kl. 14:45 |  | 550 × 325 (10 KB) | Spesh531 | Adding up to 7 billion, a year is .004 pixels | |
| 10. nov. 2006 kl. 12:56 |  | 550 × 275 (4 KB) | Dangauthier |
Filbruk
De følgende 3 sidene bruker denne filen:
Global filbruk
Følgende andre wikier bruker denne filen:
- Bruk i af.wikipedia.org
- Bruk i ar.wikipedia.org
- Bruk i ast.wikipedia.org
- Bruk i az.wikipedia.org
- Bruk i be.wikipedia.org
- Bruk i bg.wikipedia.org
- Bruk i bn.wikipedia.org
- Bruk i ca.wikipedia.org
- Bruk i cs.wikipedia.org
- Bruk i cs.wikinews.org
- Bruk i da.wikipedia.org
- Bruk i da.wikibooks.org
- Bruk i de.wikipedia.org
- Bruk i el.wikipedia.org
- Bruk i en.wikipedia.org
- The Population Bomb
- I = PAT
- Demographic transition
- Paul R. Ehrlich
- Doomsday argument
- Environmental degradation
- Population growth
- Human impact on the environment
- Intraspecific competition
- Albert Allen Bartlett
- Andrey Korotayev
- Wikipedia:Reference desk/Archives/Humanities/2006 September 4
- Wikipedia:Reference desk/Archives/Miscellaneous/2006 October 2
- Estimates of historical world population
- Wikipedia:Graphics Lab/Images to improve/Archive/Mar 2008
- World population
- Talk:World population/Archive 1
- User talk:McSly/Archive 1
- User:Bigmadrich/sandbox
- User:I worship oil
- Bruk i en.wikibooks.org
- Bruk i en.wiktionary.org
- Bruk i eo.wikipedia.org
Vis mer global bruk av denne filen.